Modeler #
The Modeler is an important part of the ETL data_snake software as it is responsible for creating Workflows and manipulating data to be Extracted, Transformed and Loaded.
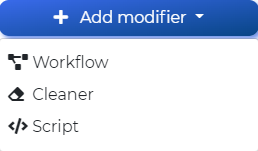
Every time you create or edit a Workflow, you will open the Modeler module. To create a new Workflow, click the Add modifier button and select Workflow.
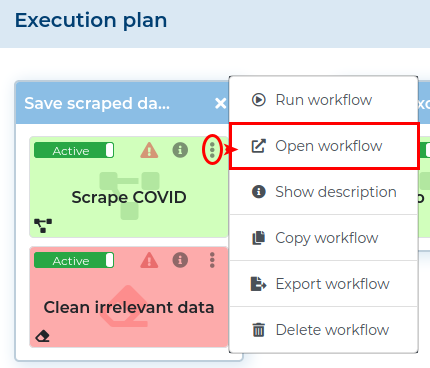
To edit an existing Workflow, either double click the list of steps in the Process Details section or click the Open workflow action from the Workflow actions.
Modeler Workspace #
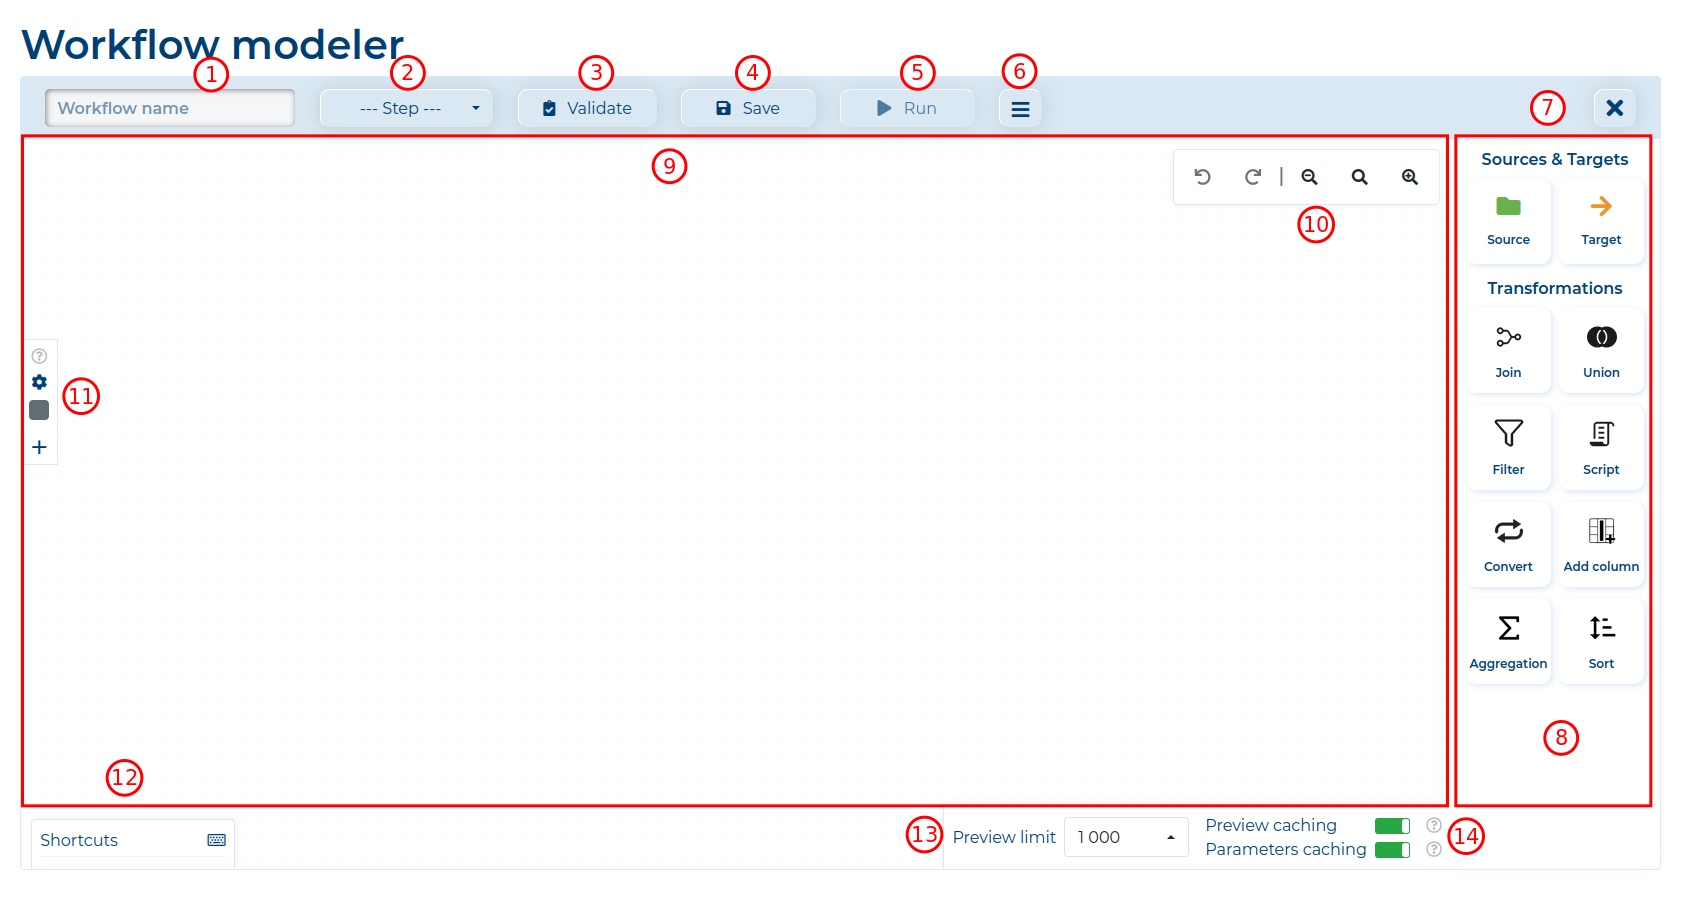
The Modeler module consists of:
-
the field to enter the Workflow’s name,
-
the field to select the Step in which the Workflow will be located,
-
the Validate button to check if all the Components are configured correctly,
-
the Save button to save changes to the current Workflow,
-
the Run button to run the current Workflow and see how much time each Node needs to finish its job (you cannot run an invalid Workflow; it stops at the first error); you can export the result to an CSV file by clicking the Export to CSV button in the upper right corner of the window.

-
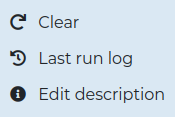
the additional actions buttons:
- Clear - remove all Components from the Workspace,
- Last run log - opens a new window with the latest run log of this Workflow;
- Edit description - modify the description of the Workflow; you can add additional information about this Workflow here,
-
the Exit button to go back to the Process Details section to which the Workflow is connected,
-
the list of all available Components; you must drag them to the Workspace,
-
the main Workspace where you drop the Components from the right,
-
the Workspace tools:
 - undo the last action on the Workspace,
 - redo the last action on the Workspace,
 - zoom out the Workspace,
 - reset zoom on the Workspace,
 - zoom in the Workspace,
-
the Grouping tools used to manage groups of Nodes,
-
the Shortcuts button, which opens a small window with keyboard shortcuts,
-
the Preview limit field, where you can set the maximum number of rows visible when previewing data; this limit refers to the number of rows extracted from the Source Nodes (e.g. if you have over
10 000rows of data and preview the data in a Filter Node, you will only see the filtered results for the first rows up to the Preview Limit); setting this toNo limitdisables preview data caching, -
the Use cache switches, which allows you to:
- enable/disable Preview caching - checking this option allows to cache preview data after first preview with given parameters; this is useful when working with large datasets when you need to view if the returned data is correct.
- enable/disable Parameters caching - checking this option allows to cache parameter values. If this option is turned off, the application will noticeably slow down, as the Process Parameter values will be refreshed with every request.
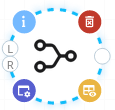
When you drag a Component from the list and drop it on the Workspace, it is represented as a circle with its respective icon. This is called a Node. When you click such a Node once, you will display three icons:
 - check/add description for this Node,
 - remove this Node,
 - configure this Node,
 - preview data generated by this Node.
Additionally, if it is a Source or Target Node, a small rectangle will appear with icons representing various available data sources or targets.
Double-clicking the Node will also open the configuration window for any Node.
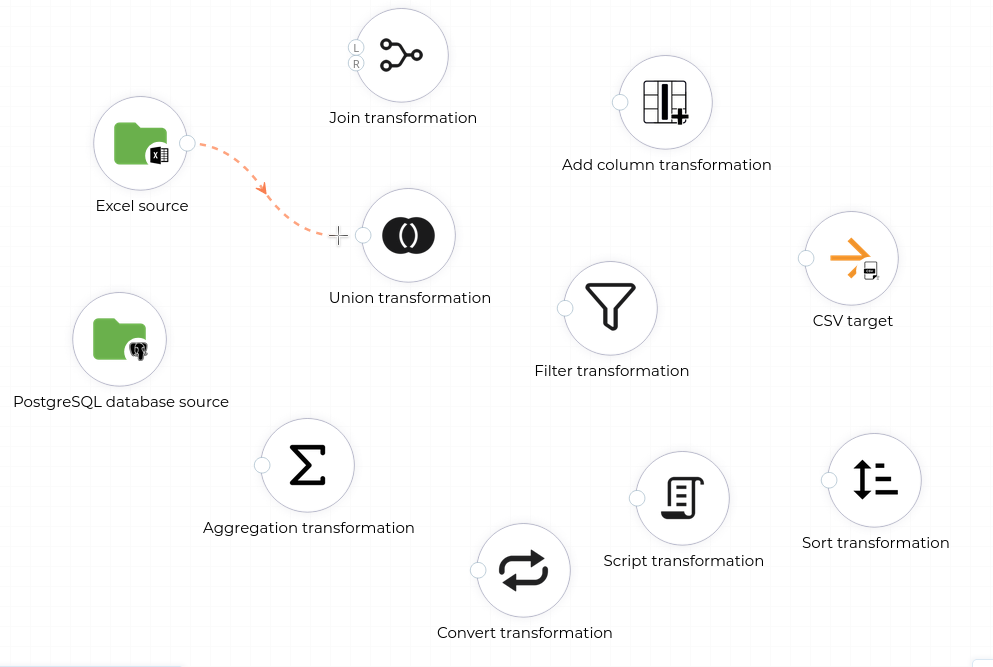
You will also see small circles on the left and/or right side of the Node symbolising if the Node needs to have input (left circle) or output data (right circle) provided to/from it. The output circle appears also when you hover on the Node.



The Join Node has two circles for inputs symbolizing the LEFT and RIGHT tables that will be joined.
When you click on the output circle, an orange arrow will appear and the input circle will appear on all Nodes that can receive input. To connect to a Node, click on any of the input circles in Nodes (the Node that you will connect to will have its input circle highlighted orange).
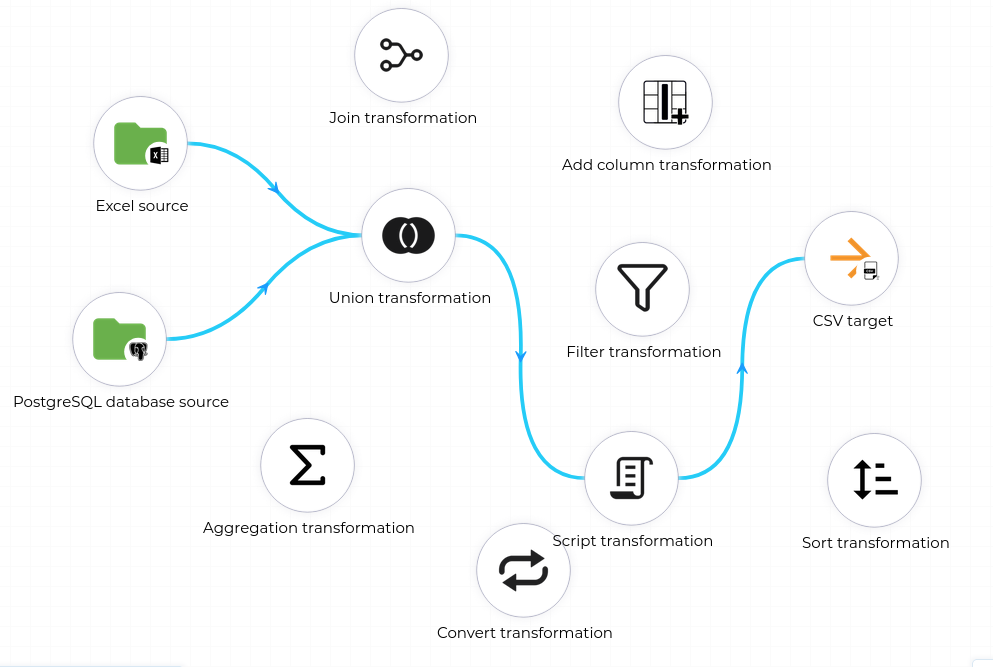
Connected Nodes have a blue arrow between each other.
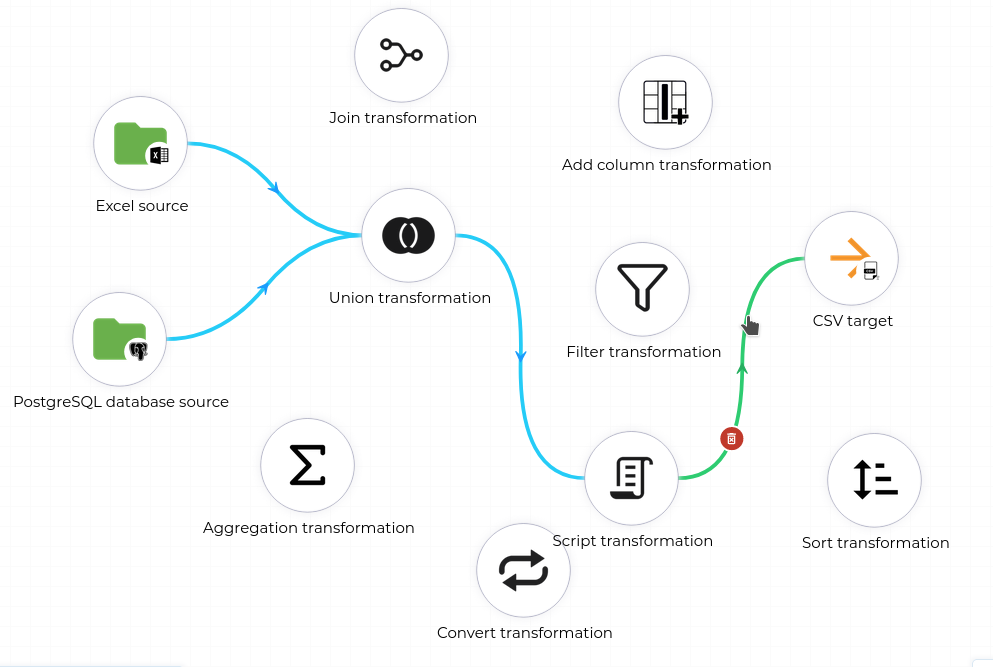
To remove the connection between components, either remove one of the Nodes or
select the blue arrow and click the  icon.
A selected connection changes from a blue arrow to a green one.
By clicking the Validate button you can see if the Workflow you created has a valid structure. If not, all Nodes that need to be fixed will be marked red and an error message will be visible, informing about the main problem with the Workflow structure.
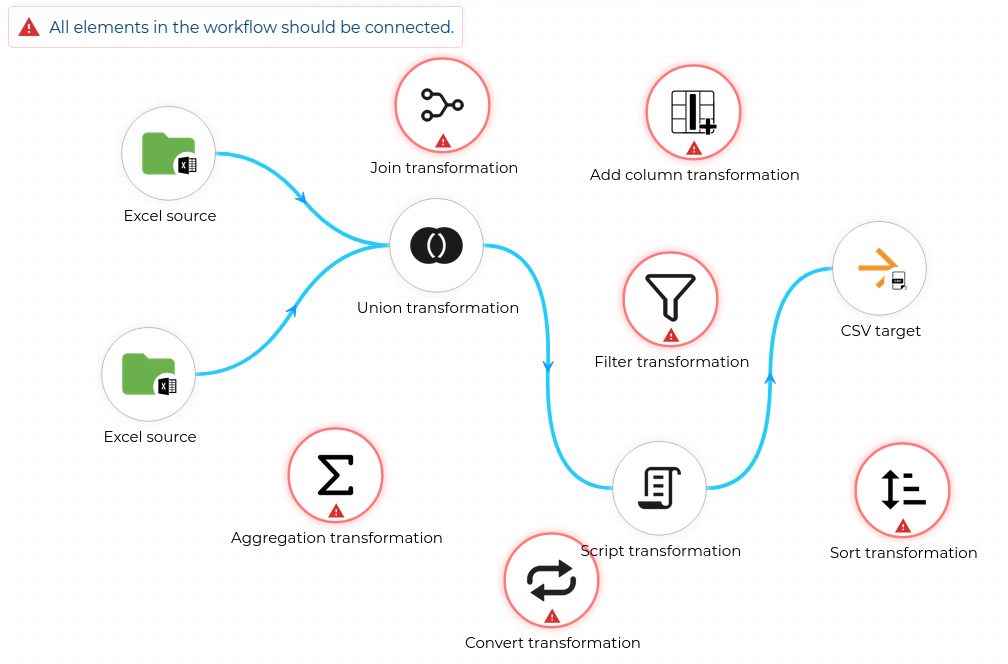
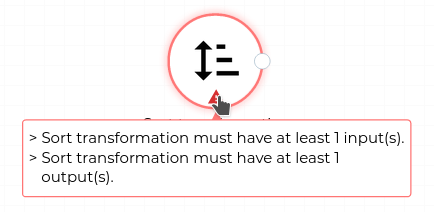
Hovering on the  icon will display the errors that need to be
resolved to make this Node valid. Clicking the icon will display a window with all the
errors.

After you fix the errors, remember to click the Validate button, as the error message andicons remain displayed until the next validation.
Node Groups #
If you want to select more than one Node, you can do so by holding CTRL and
clicking on each Node to group them. You can also just select Nodes by holding the
left mouse button. All selected Nodes can be moved or deleted together. You can also
create a group for all Nodes for later use. To do so, select all the Nodes you wish to
add to a group and click the ![]() icon on the
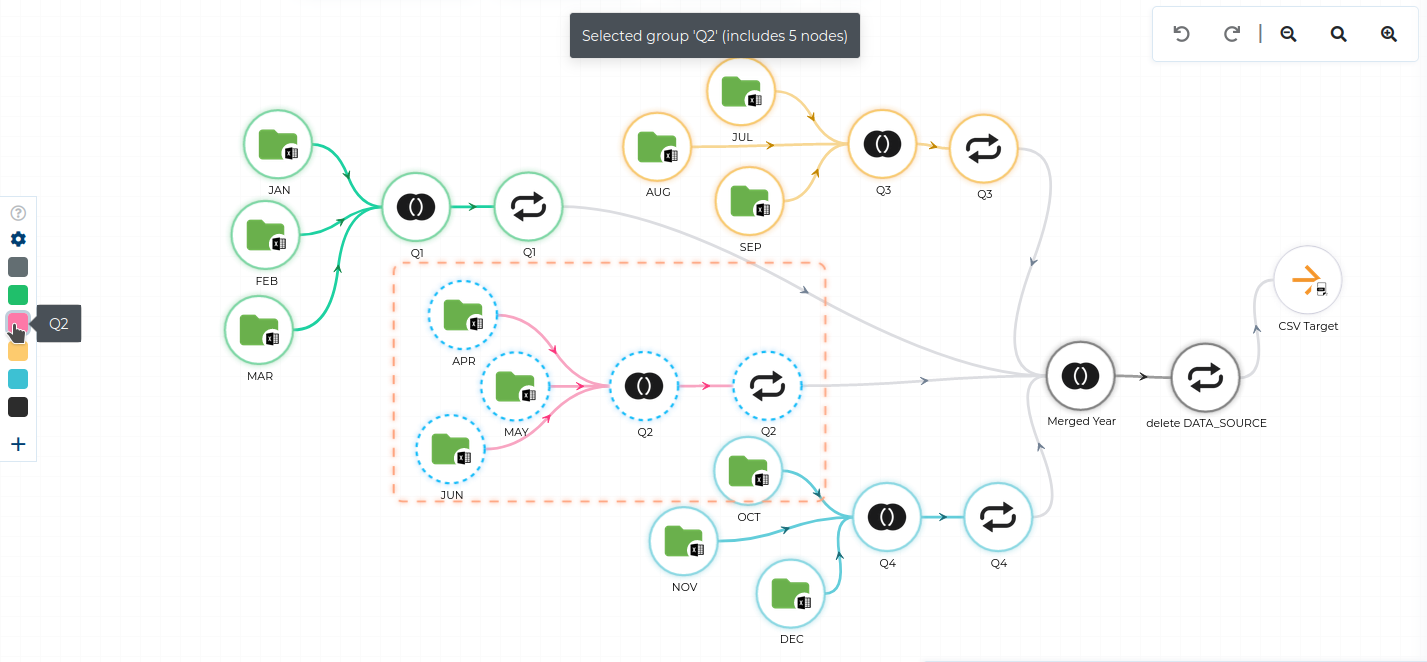
Grouping tools. This will open a new window where you must provide the new group a
icon on the
Grouping tools. This will open a new window where you must provide the new group a name
and select a color for the group. You can optionally provide a description for the group.
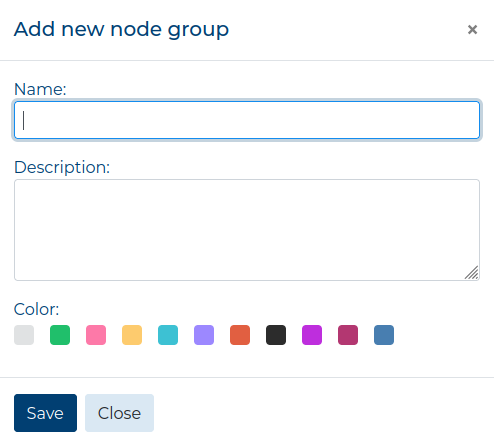
There can only be 11 groups (with the default group for all ungrouped Nodes). Each group must have a uniquenameandcolorper Workflow.
To manage all available groups, click the ![]() icon.
This will open a new window, where you can modify the
icon.
This will open a new window, where you can modify the name, description and color (if
there are any unused ones) of the already created groups for this Workflow.
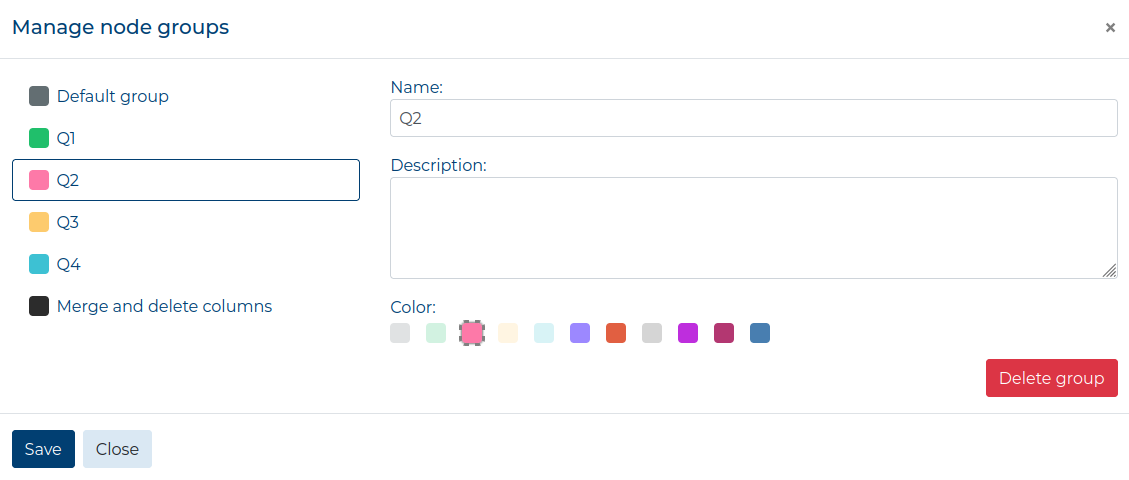
All Nodes that are part of a group have their border and connecting arrows colored using the group’s color. Clicking the group’s color will select all the Nodes that are part of the group. Selected Nodes have a dashed blue border.
Workflow Validation #
A valid Workflow is one that has at least one Data Source and one Data Target. All Components need to have a correct number of inputs and outputs and all must be correctly configured (i.e. have correct columns mapped for the Join Transformation, the Excel source has a valid sheet name chosen, etc.)
Data Preview Window #
When you click the  icon on any correctly configured
Node, a preview window will appear with data Extracted, Transformed or Loaded by that
Node. In the window you can find:
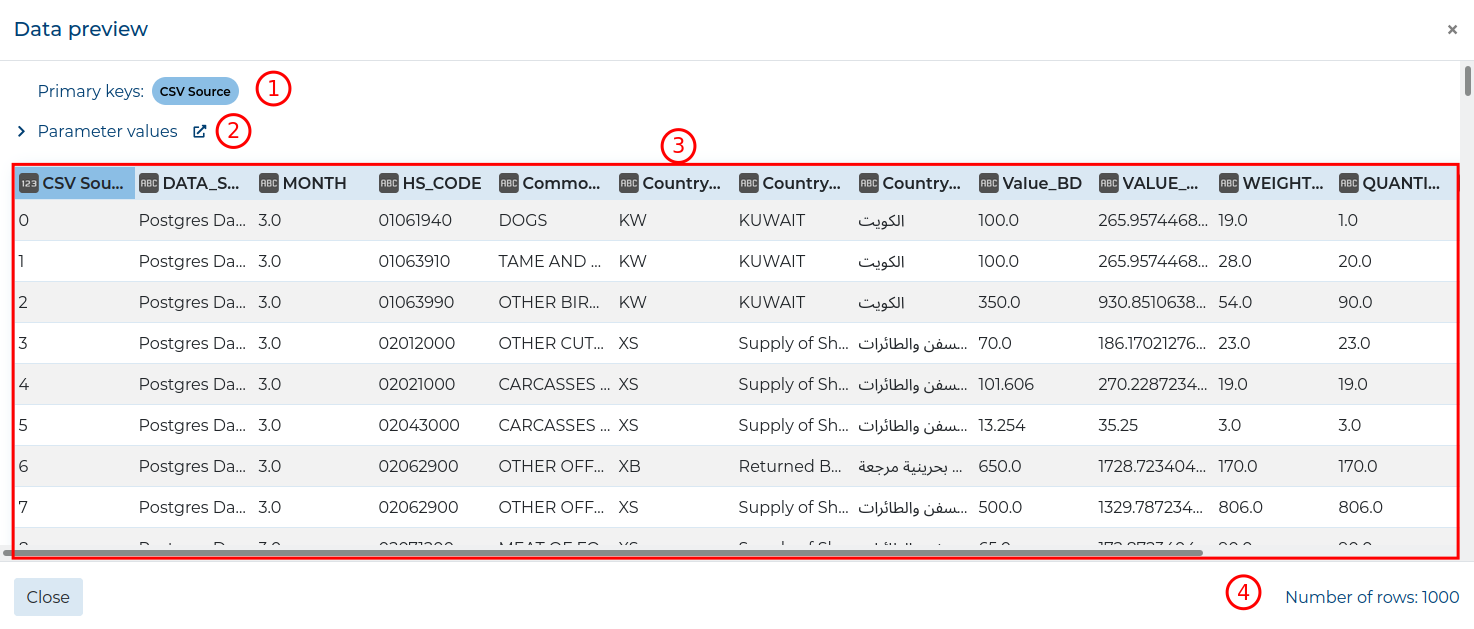
- The Node Title of the previewed Node,
- The value of the Parameters used to generate the previewed data,
- The table with data; the first row are column names with icons representing their data types; the leftmost columns marked by a darker shade of blue are the index columns,
- The number of presented rows; it is either equal or lower than the Preview limit.
Previewing data will emulate all extractions and transformations that happen before the previewed Node. It is recommended to toggle on the Use cache switch before previewing data, especially when handling large amounts of data!
You cannot preview data if there are Nodes on the Workspace that are not configured yet.
You cannot preview data, if the previewed Node or any of the Nodes preceding it have errors!
For further information, navigate to any of the following sections:
