Home Page #
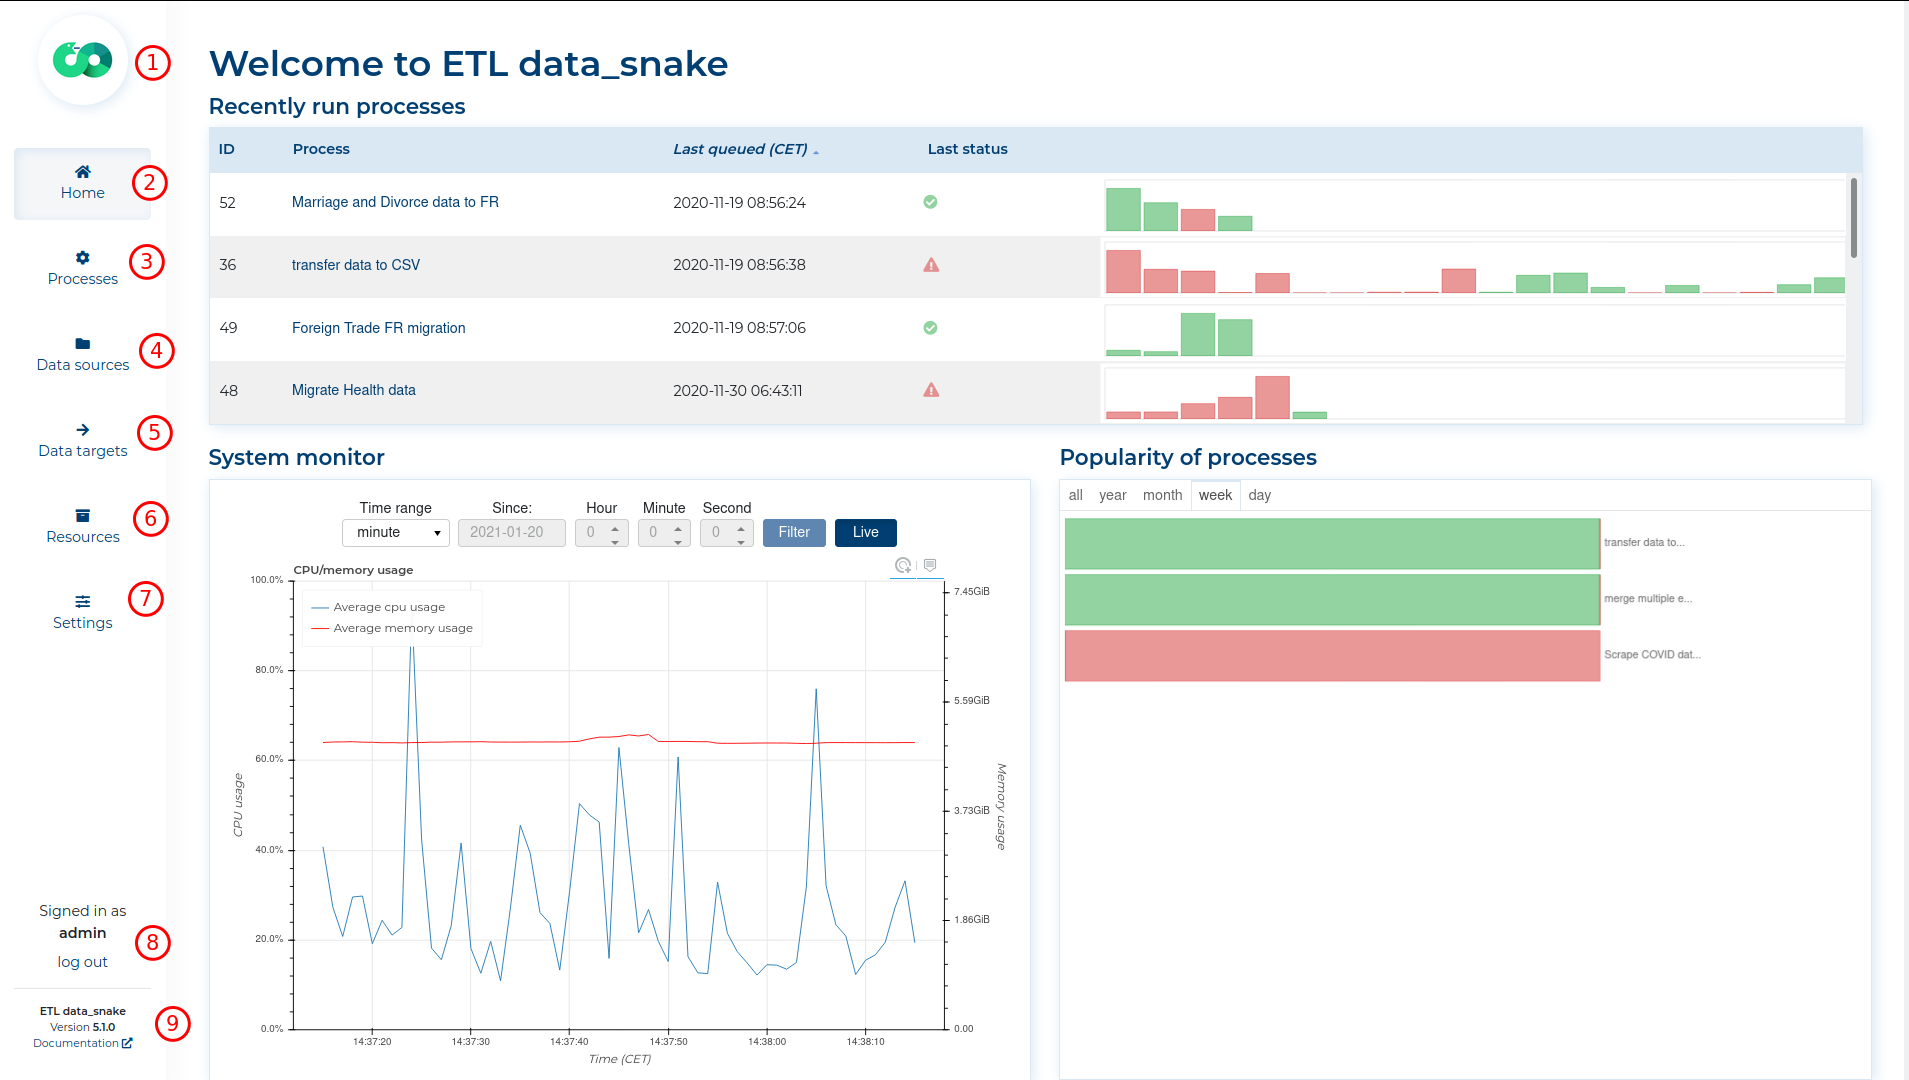
After logging into ETL data_snake, you are navigated to the Home section. On the left, you will see the main application menu, which is visible on every page. The menu consists of:
- The ETL data_snake logo, which will navigate you to the Home Page,
- The Home button, which will also navigate you to the Home Page,
- The Processes button, which will navigate you to the Processes list,
- The Data sources button, which will navigate you to the Predefined Sources list,
- The Data targets button, which will navigate you to the Predefined Targets list,
- The Resources button, which will navigate you to the list of files stored by ETL data_snake,
- The Settings button, which will navigate you to the settings page (it can be accessed by Users with
the
administrationPermission), - The currently logged-in User, with the log-out button below it,
- The current version of ETL data_snake, with the Documentation button below it, which will open this documentation page.
On the right, you will see statistics about the software:
Recently Run Processes #
This statistic is a table showing a list of 10 recently run Processes and their last 20 executions and duration. Each element of the list consists of:
- the Process ID,
- the Process name; you can click it to navigate to that Process details section,
- the Date the Process was last queued for running; time displayed in UTC,
- the Status of the last Process execution,
- a column graph showing the last 20 executions of the Process; red columns show failed executions and green columns show successful executions; the height of the columns represents the Processes execution duration.

Hovering on any of the columns in the graph will display details about this particular execution:
- its Duration,
- its Status,
- the Date the process was queued for running,
- the Date the process started.

Popularity of Processes #
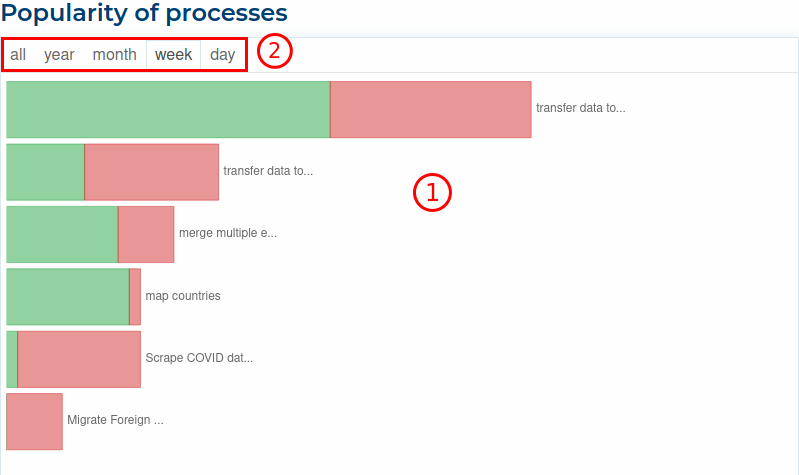
This statistic shows a graph of all run Processes and the number of their
successful and failed executions (1). Red sections of each column represent failed executions
and the green sections show successful executions. You can choose to show statistics for
today, for the last week, for the last month, for the last year and all statistics about
Processes run by the ETL data_snake software using the tabs above the graph (2).
The Processes popularity is its number of executions. The Processes in the graph are sorted by popularity (from the most popular).
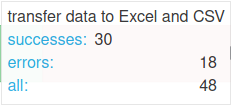
Hovering on any of the columns in the graph will display details about this Process:
- its Name
- how many executions ended successfully,
- how many executions ended in failure,
- the total number of executions of this Process,
Clicking the column will navigate you to its Process.
System Monitor #
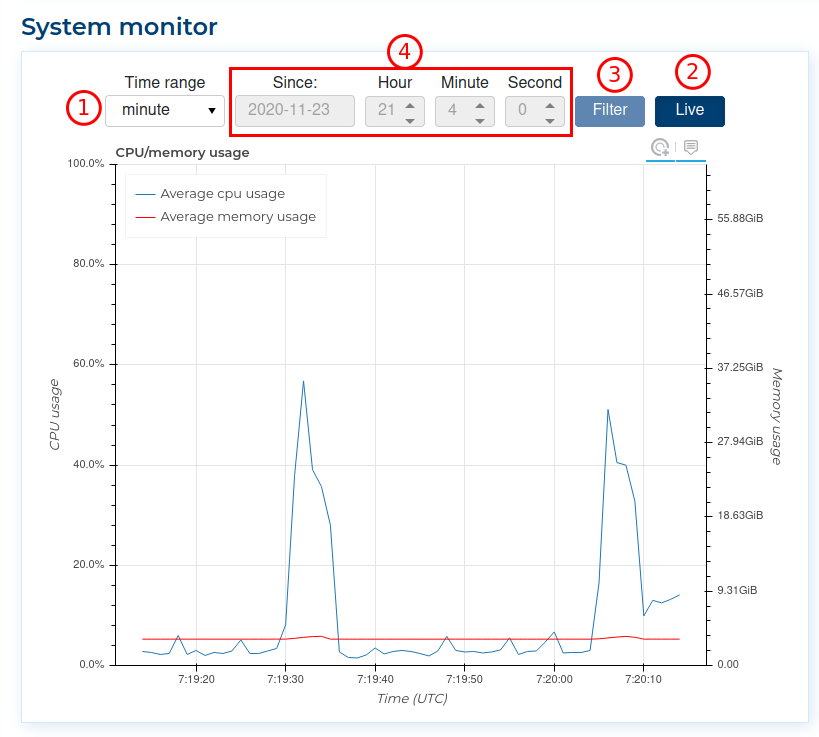
This statistic shows a line graph of average CPU and RAM usage by the machine running the
ETL data_snake software. It gathers data every second and stores data up to 31 days (default
settings of the ETL data_snake software). The Memory usage axis scales from 0 to the total
amount of RAM installed on the machine running the ETL data_snake software.
By default, the chart represents current data. You can change the Time range (1) to see
minute, hourly, daily, and monthly data. If you click the Live button (2), you can
switch between current data and filtered data. If the Filter button (3) is active, this
means you are not seeing new data and can click the Filter button to filter the chart to
show data since the time set by the filter fields (4) (e.g. selecting
hour 2020-11-11 1:10 will show data from 01:10 do 02:10 on November 11th 2020; selecting
month 2020-11-11 will show data for one month since November 11th).
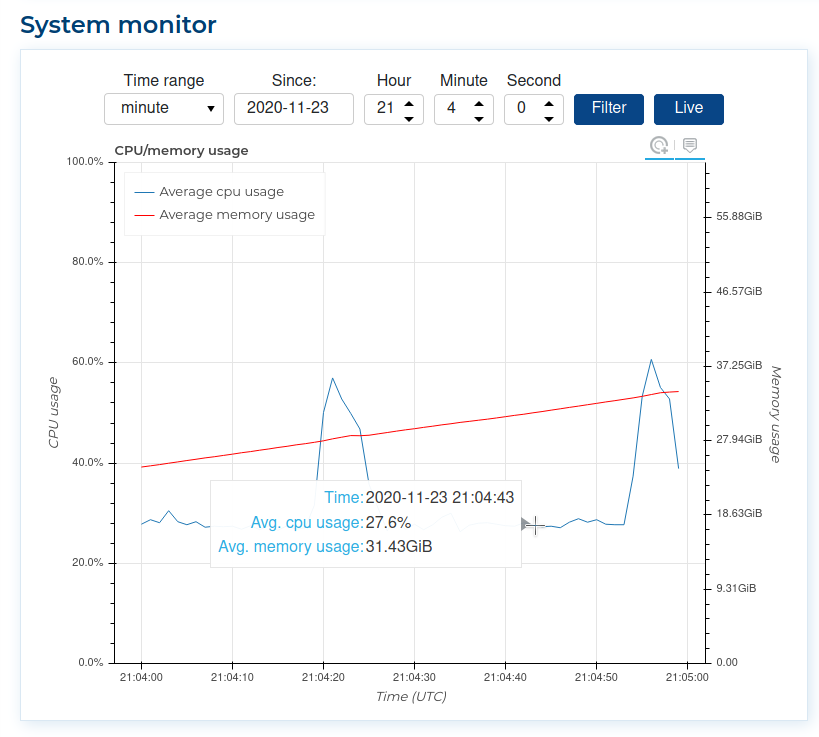
When you hover the cursor over the graph, it will show you the following information:
- Time - the time when the data was collected,
- Avg. cpu usage - the average percent of CPU usage,
- Avg. memory usage - the average amount of RAM usage,

You can click on a specific part of any line on the graph to zoom in and see statistics for a smaller
time period that line represents (maximum zoom is minute). The zoom feature does not show live data,
so zooming in will only show the filtered period, not the live data feed.
Example
Hourly data before zoom
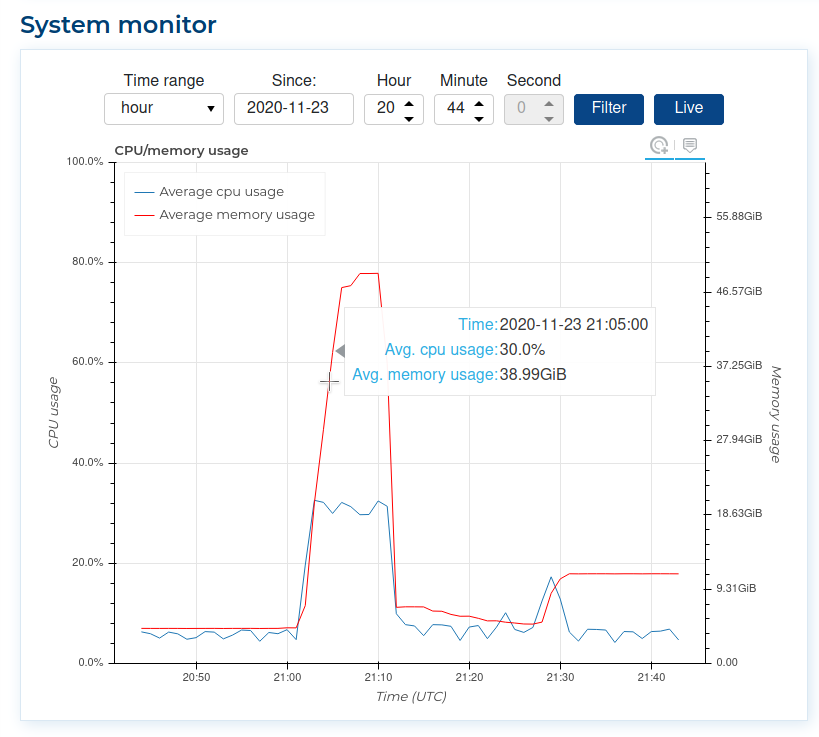
Zoom in from hourly data to minute data from 9:04 PM to 9:05 PM
