Transformations #
The Transformations components are used to modify the extracted data before loading it to the Target
Each Transformation requires data tables to be provided as input.
All Transformations will generate a data table as an output.
Every data table contains data and metadata (column names and their data types). For optimization, every Transformation can return a data table with the same columns names and data types - it does not matter whether the Transformation received a data table with data or not.
Join #
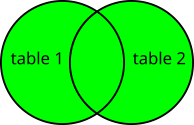
This Transformation generates a combination of records based on a related column in two tables. The Join Transformation requires exactly two input tables. The data is joined based on the same values in the columns from both tables. You have to choose the columns used in the join and the type of join to make:
- Left - only join data from the first table and matching data from the second table;
not matching data will be replaced by
None,

- Right - only join data from the second table and matching data from the first table;
not matching data will be replaced by
None,

- Outer - join all data from both tables; not matching data will be replaced by
None,

- Inner - only join matching data from both tables; not matching data will be omitted,

Each column in the resulted table will have a prefix that tells from which data table it came from (left_ for the first table and right_ for the second table).
Union #
This Transformation generates a table that has data from at least 2 data tables (maximum 5) which have the same columns (the data does not need to be the same).
The generated table will have data from all input tables in order from the first to last.
The generated table will have an additional column added as the first column called
DATA_SOURCE which will indicate the table from which the data is.
Data tables used as input must follow the following requirements:
- They must have the same number of columns,
- They must have the same column names,
- The corresponding columns in all data tables must have the same data type,
- They cannot have a column named
DATA_SOURCE.
Either load data tables that complies with the requirements or use the Convert transformation to generate correct data tables.
By default, the values in the DATA_SOURCE column are generated from names given to the components
in the Modeler. Additionally, you can provide a list of Aliases to use instead
of the default values.
Filter #
This Transformation only takes one table as input and generates a table with filtered data. You must provide how to chain all provided filters:
- And to filter data that matches all filters,
- Or to filter data that matches any of the filters,
Then, add the filters by selecting the column, condition and value for each filter. The available conditions are:
- == (equals) - data matches the provided value,
- != (not equals) - data does not match the provided value,
- < (less than) - data is less than the provided value,
- <= (less than or equal) - data is less than or matches the provided value,
- > (greater than) - data is greater than the provided value,
- >= (greater than or equal) - data is greater than or matches the provided value,
- isnull (is null) - data does not have any value,
- notnull (not null) - data has any value and is not
None,
Script #
This Transformation is for advanced users. It allows them to use a Python script to create
custom modifications to the data tables, not available by other Transformations. The
Script Transformation can use more than one data table as inputs (available in the
INPUT_DATA list variable) and must return a Python Pandas DataFrame.
This Transformation must work if an empty Python Pandas DataFrame is used as an input! Remember to prepare this Transformation correctly, otherwise the modifier might not work properly!
Working with the Script Transformation #
Because every Transformation can return a data table with the same columns names and data
types whether with data or not, the Script Transformation must also handle such a case.
Analyze this simple example Modifier. Before we convert the columns into correct data types for the target database, we add some columns using the Script Transformation. When we edit the Convert Transformation, an empty data table is passed through the Script Transformation and input for the Convert Transformation to work. This is done because it is faster to pass just the column names and data types when you just want to work on them and not see actual data.
Refer to these two other examples:
Script modifying only structure #
We want to gather data from a remote Excel file and prepare it to load to a database table.

The database table has a column showing who added the data, so we add this column using the Script Transformation.
def script (INPUT_DATA, PARAMETERS):
    import pandas as pd


    df = INPUT_DATA[0]

    # add column
    df['new_column'] = "ETL data_snake"

    return df
As we do not operate on data, this code will work both on an empty data table and one
with data. When we use the Convert Transformation to remove and rename some columns and
change the rest to correct data types (data from files sets all column data types to string
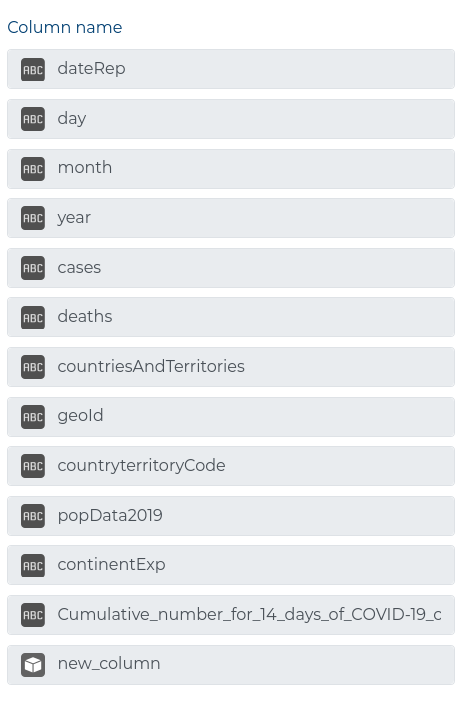
(normal text)) we can edit the following columns in the Convert Transformation:

Script modifying data and structure #
Now we take the data that we pushed to the database…
| Date | cases | deaths | country | continent | added_by |
|---|---|---|---|---|---|
| 2020-12-14 | 27 | 5 | Angola | Africa | ETL data_snake |
| 2020-12-14 | 586 | 1 | Ecuador | America | ETL data_snake |
| 2020-12-14 | 718 | 7 | South_Korea | Asia | ETL data_snake |
| 2020-12-14 | 8976 | 188 | Poland | Europe | ETL data_snake |
| … | … | … | … | … | … |
… and transform it to only show all cases per continent per day:
| Date | Africa | America | Asia | Europe | Oceania | Other |
|---|---|---|---|---|---|---|
| 2019-12-31 | 0 | 0 | 27 | 0 | 0 | 0 |
| 2020-01-01 | 0 | 0 | 0 | 0 | 0 | 0 |
| 2020-01-02 | 0 | 0 | 0 | 0 | 0 | 0 |
| 2020-01-03 | 0 | 0 | 17 | 0 | 0 | 0 |
| 2020-01-04 | 0 | 0 | 0 | 0 | 0 | 0 |
| … | … | … | … | … | … | … |
As we will work on data and not just the data structure, writing a regular script will not work:
def script (INPUT_DATA, PARAMETERS):
    import pandas as pd
    df = INPUT_DATA[0]

    df = df.pivot_table(
        index='Date',
        columns='continent',
        values='cases',
        aggfunc='sum',
        fill_value=0
    )

    return df

That is why we need to take into account that a data table with no data can be input in
the Script Transformation and should return a dataframe with the same structure as the one
with data. That is why we need to use an if-else statement:
def script (INPUT_DATA, PARAMETERS):
    import pandas as pd
    dataframe = INPUT_DATA[0]

    if dataframe.empty:
        return pd.DataFrame(
            index=['2019-12-31'],
            columns=['Africa', 'America', 'Asia', 'Europe', 'Oceania', 'Other'],
            dtype='Int64'
        )
    else:
        return dataframe.pivot_table(
            index='Date',
            columns='continent',
            values='cases',
            aggfunc='sum',
            fill_value=0
        ).astype('Int64')
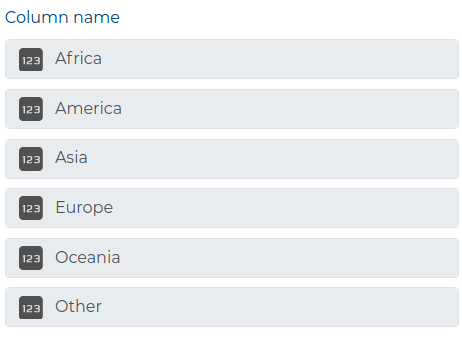
The above script makes sure that when we open the Convert Transformation we will see all the columns that are generated by the Script Transformation.

Available Packages #
Here is a list of available packages to use in your Script:
- all packages in the Python Standard Library,
- the pandas manipulation tool,
- the dateutil module for date and time manipulations,
- the NumPy fundamental package for scientific computing with Python,
- the OpenPyXL library to read/write Excel 2010
xlsx/xlsm/xltx/xltmfiles, - the xlrd library to read old
xlsExcel files, - the odfpy library to read and write OpenDocument files (i.e.
ods), - the pandaSDMX library for
SDMX-MLdata manipulation, - the SQLAlchemy Python SQL toolkit and Object Relational Mapper,
- the Requests library for sending HTTP requests,
- the Beautiful Soup library for pulling data out of HTML and XML files,
- the pyodbc module for accessing
ODBCdatabases, - the wbgapi module for accessing the World Bank’s economic data,
- the pandas-datareader library for fetching financial data into pandas DataFrames.
- the html5lib pure-python library for parsing HTML.
Convert #
This Transformation takes a single data table as input and modifies its column structure. Each column from the table is presented to you, and you can choose the following options for each column:
- Alias - change the column name,
- Casting type - change the column data type to a different type; available
data types: Integer (
'Int64'), Float ('float64'), String (regular text -string), Boolean (having two possible values calledtrueandfalse-boolean), and Datetime (object representing time -datetime64[ns]). - Active - whether to keep or delete the column from the table,
Add column #
This Transformation allows you to add columns to the data structure with a specific value. You choose the name, type and the place where new column will be positioned in the data structure.
Aggregation #
This Transformation allows you to split data into groups, apply an aggregation function to each grouped column and combine the results into a new data structure. This transformation allows to compute a summary statistics for each group like sums, counts or means. The resulting data structure will have only the selected columns with grouped values (dropped duplicates) and new columns representing each aggregation applied to all the grouped columns.
If you select only grouped columns, then you will receive a new data structure with only the grouped columns. If you select only aggregations, then you will receive a data structure with added columns with the same values as the columns that were to be aggregated. Remember to always provide a list of grouped columns and at least one aggregation!
Aggregation methods #
All those methods work on columns of Integer and Float type and only some of them can be used for columns with other types (e.g. String, Boolean, DateTime).
MIN- Minimum of group values (e.g.MINof (5, 10, 15) will be 5),MAX- Maximum of group values (e.g.MAXof (5, 10, 15) will be 15),COUNT- Count of group values (values that evaluates to True), (e.g.COUNTof (0, 10, 5, 0, 12, 0, -4) will be 4),SUM- Sum of group values (e.g.SUMof (5, 10, 15) will be 30),AVERAGE- Average of group values (e.g.AVERAGEof (5, 10, 15) will be 10),SIZE- Count of group values (True and False) (e.g.SIZEof (0, 10, 5, 0, 12, 0, -4) will be 7),STANDARD DEVIATION- Compute standard deviation of groups (e.g.STANDARD VARIATIONof (2, 1, 3, 1.75) will be 0.826),VAR- Compute variance of groups (e.g.VARIANCEof (2, 1, 3, 1.75) will be 0.6823),STANDARD ERROR- Compute standard error of the mean of groups (e.g.STANDARD ERRORof (2, 1, 3, 1.75) will be 0.413)FIRST- Get first element of group values (e.g.FIRSTof (0, 10, 5, 0, 12, 0, -4) will be 0),LAST- Get last element of group values (e.g.LASTof (0, 10, 5, 0, 12, 0, -4) will be -4),MEDIAN- Get median of group values (e.g.MEDIANof (2, 1, 3, 1.75, 0, 2.6) will be 1.875)
This transformation ignores
Nonevalues. See example below:
product price $ country apple 3 POL pear 11 POL banana None POL apple 5 FRA pear 7 FRA banana None FRA apple 10 IDN pear None IDN banana 9 IDN Grouped by product:
product SUM price AVERAGE price SIZE price apple 18 6 3 pear 18 9 2 banana 9 9 1 While average of:
PEARSis (11 + 7 + 0) / 3 = 6BANANASis (0 + 0 + 9) / 3 = 3
Sort #
This Transformation allows you to sort the whole dataset by specified columns in the
chosen order. The sorting can be ASCENDING or DESCENDING.
EXAMPLE
product price $ country apple 3 POL pear 11 POL banana None POL apple 5 FRA pear 7 FRA banana None FRA apple 10 IDN pear None IDN banana 9 IDN Sorted by country product
DESCENDING:
product price $ country pear 11 POL banana None POL apple 3 POL pear None IDN banana 9 IDN apple 10 IDN pear 7 FRA banana None FRA apple 5 FRA Sorted by price
ASCENDING:
product price $ country apple 3 POL apple 5 FRA pear 7 FRA banana 9 IDN apple 10 IDN pear 11 POL banana None POL banana None FRA pear None IDN As you can see,
Nonevalues are ignored and left at the end in the order they appeared.